Fuel Management System

Fuel Management Systems: How to Get Ahead

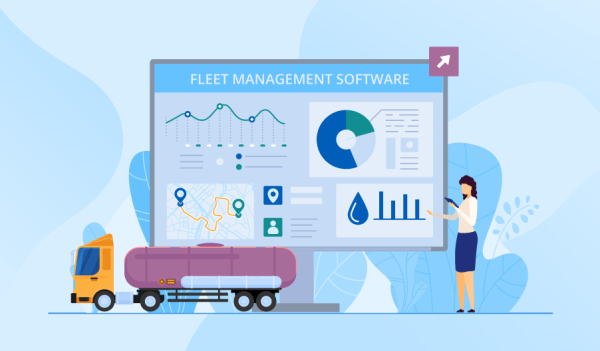
Like it or not, fuel is the biggest expenditure for efficient fleet management. A custom fuel management system is the perfect solution to understand gas consumption within your fleet.

Many fleet managers are incorporating fuel management systems into their daily operations. Leveraging telematics technology offers valuable insights into fuel usage and allows you to optimize this valuable asset across the board.

A fuel management system enables fleet managers to track fuel usage patterns across their fleet. A typical automated fuel management system includes onboard hardware such as vehicle telematics units, data loggers, sensors, and cameras, as well as an in-office analytics dashboard and fuel management software.

Extra integrations and mobile apps are also popular features of these systems.

Without a fuel management system in place, managers often find themselves overspending on fuel and repairs, and drivers may run out of fuel as the result of a misgauged fuel meter or taking trips without optimized routes.

What Are the Benefits of a Fuel Management System?

Fleet management is comprised of a number of factors outside of vehicles; there are operating systems, assets and expenditures to take into account.

A fuel management system allows fleet managers to monitor asset usage for gasoline, diesel, truck repairs and maintenance services. These systems also generate compliance reports, limit operational risks, provide real-time fuel consumption data, and optimize fuel allocation, giving managers a truly holistic overview of their fleet.

Benefits for Fleet Managers

According to a recent study, aggressive driving increases fuel costs by up to 30%. The study also notes that unsafe or aggressive driving behaviours in urban areas drive air pollutant emissions up by 40%, regardless of the road grade.

With a well-developed fuel management system, fleet managers can track data like fuel usage, road grade, operational risks, real-time trip statistics, fuel consumption data, fuel allocation, and much more.

This data can also help them improve route planning and asset utilization, develop more effective vehicle maintenance schedules, and gain holistic insights into fuel economy.

fuel management system

Benefits for Drivers

Drivers benefit from data sets provided by fuel management systems as well. For example, refueling alerts, streamlined receipt/expense management and route optimization all offer drivers a safer, more efficient trip.

Fuel theft and unauthorized use of fuel continues to be a persistent issue, so ensuring that each and every fleet vehicle has a monitoring system in place can save your drivers from suspicion.

No matter what your fleet does, what products or services they deliver, or how many vehicles are involved, fleet management is an important tool that can help optimize assets and minimize expenses.

Why are Fuel Management Systems Important?

Small issues can become serious ones if not repaired in a timely manner. According to Intellias:

  • Flat or under-inflated tires can reduce mileage by up to 30%
  • Engine problems reduce mileage by 4% on average
  • Faulty oxygen sensors cut up to 40% off mileage
  • Brake drag can also affect driver safety and fuel consumption.

A fuel tracking system can track anomalies in your fleet’s fuel consumption, which can be either indicative of potential maintenance issues or the result of driving behaviour.

With detailed and real-time data on fuel usage and expenditures, a fleet manager can ensure that assets are properly distributed, repairs are managed as needed, and that drivers are supported and well-prepared to do their jobs.

Many mechanical issues can impact fuel consumption, including the amount of fuel used, mileage, the quality and safety rating of your engines, the cost of fuel, and repair services.

Having a properly developed fuel management system can help mitigate these risks and expenses not only by giving you a window into your fleet’s performance, but by protecting your drivers and overall fleet performance.

The more advanced these systems become, the more predictive they can be, which means you can identify the best scheduling sequence for vehicle repairs.

Fuel management systems can mitigate logistical issues, and in many cases can prevent them from happening in the first place.

fuel management system

How Can I Create a Fuel Management System?

Developing and installing a custom fuel management system is no easy feat, but the professionals at GoFleet can help you build a regulatory monitoring system designed for your fleet’s specific needs.

Whether you need to measure fuel levels in real-time, identify fuel consumption patterns per vehicle or detect fueling locations, a fuel management system will enable you to do just that.

The priorities for any fuel management system are convenience and control. If you’re looking to install a fleet management system for your team’s vehicles, contact us at GoFleet for a consultation today.

power take-off, gofleet, tax, return, refund, iox aux, fleet

All You Need to Know About Power Take-Off and Tax Refunds

Power take-off (PTO) is a crucial device used to transfer mechanical power from vehicle engines to other pieces of equipment. It is adopted in a wide range of industries and sectors, such as forestry, energy, winter operations, waste management and many more. It allows the vehicle’s add-on equipment to extract and receive power from the vehicle’s host energy sources without installing an external energy source. 

Many fleet managers and asset operators favour PTO as an efficient and reliable way of attaching additional equipment and machinery to the vehicle, which helps them complete demanding tasks and dramatically expand vehicle utility. As a telematics company, we pride ourselves on using an innovative approach to derive changes and outcomes and we decided to give PTO a magical refresh and update. Our approach focuses on helping you extract the most information from PTO systems, which empower your operation to unmatched efficiency and drives down costs. 


The GoFleet Way of Mastering the Power Take-Off (PTO) System

Our IOX-AUX Harness links auxiliary sensors to our industry-leading fleet tracking systems, which enable operators and fleet managers to access information that they previously could not see. The IOX-AUX facilitates advanced sensor monitoring, enabling fleet managers and operators to view the real-time status and activities of the PTO. Fleet managers are also able to set up exception rules in the system to restrict and monitor operators’ behaviours, and any violation will trigger alerts, which immediately notify fleet managers to take appropriate actions. One of the most useful capabilities of PTO integration is that the system can organize PTO sensor data and formulate detailed reports at the end of the operations, which inform fleet managers about any event or violation that took place during the operation. These reports are also extremely valuable and helpful to fleet managers when preparing and submitting fleet management reports to the corporation’s executive team. Being able to extract more data and insights from the PTO system simply gives businesses a leading-edge over its competitors as these pieces of information can help fleet managers and executive teams better optimize the operation through a data-driven approach.  

Talking about system expandability, we want to offer you the most choices out of competitors. That’s why our IOX-AUX harness supports up to 4 digital inputs each. With two IOX-AUX, you can monitor up to 8 inputs at any time. If you have multiple sensors or inputs needed to track on a vehicle, you now have the complete freedom and control to do so. For example, fire truck operators or fleet managers may want to monitor sirens, fire pumps and aerial ladder activities simultaneously. It is vital for them to have access to all parts’ status and real-time information at one intuitive software interface, especially during an emergency operation. This poses stringent standards for the telematics solution as fleet managers and operators demand a high level of connectivity and integration, which allows them to monitor every component and part of the fire truck. Our solution, which supports up to 8 inputs, can handle these kinds of tasks with ease. No matter which part you want to track and monitor, you can link them with the vehicle onboard GPS tracking system through IOX-AUX to experience a streamlined workflow. 

When you are ready to go, we also want to make sure the installation process of IOX-AUX is simple, easy and problem-free. Our plug-and-play installation process guarantees that your entire system will be up and running in under a few hours. The USB connector of the IOX-AUX connector plugs right into the GPS tracking device, and you just need to connect the desired auxiliaries to the IOX-AUX wire as needed. There is no complex configuration or additional hardware required, and the installation process is easy enough where you can self-install and set them up by following our step-by-step instructions. 


Economic Returns of Using Power Take-Off Device

Did you know that you may be qualified for a refund if you paid tax on fuel used in Ontario to operate power take-off equipment? If your fleet qualified for the requirements listed below, you could apply for a power take-off tax refund:

  • The vehicle is licensed to operate under the Highway Traffic Act
  • The use of the auxiliary equipment occurs in Ontario
  • The motor vehicle is not used to transport passengers
  • The auxiliary equipment is powered using the same power source that is used to power the vehicle
  • No use of the power from the auxiliary equipment to drive the vehicle
  • No use of the auxiliary equipment for personal use, pleasure or recreation
  • Have paid fuel tax to Ontario 

A refund request must be filed and received by the Ministry of Finance within four years of paying the fuel tax. Remember that your fleet needs to meet all the above conditions to get a power take-off tax refund, and the exact amount of refund will be determined and calculated based on the vehicles’ total distance travelled in Ontario. 

DISCLAIMER: Before placing the information contained within this article in your fleet strategy, it is always recommended that you perform your own research and speak to the appropriate individuals to ensure it is right for you.


Q&A of Tax Refund for A Power Take-Off


Question: How is the refund being calculated?

Answer:

Calculating A Refund – PTO Activity Before July 1, 2017

There are two ways to measure the fuel used during the PTO operations; you may use either one of the below:

  • Readings from meters or electronic control modules that measure the fuel supplied to the auxiliary equipment
  • Set allowances approved by the ministry for different kinds of PTO operations, based on information from equipment manufacturers

You may need to contact the ministry to confirm if there is an approved allowance for your equipment. 


Calculating A Refund – PTO Activity After July 1, 2017

Starting from July 1, 2017, the PTO refund is calculated by applying a pre-determined percentage allowance against the total fuel disbursed to the licensed vehicle containing the qualifying auxiliary equipment.

You can find the PTO allowance chart on the Ontario Ministry of Finance website, which outlines in detail what the allowance is for different PTO activity types. 


For Inter-jurisdictional Carriers

For inter-jurisdictional carriers, the refund is calculated based on the vehicle’s total distance travelled in Ontario during the claim period. The following example will help you better understand how the refund portion is calculated. 

An IFTA licensed carrier (carrier licensed under the International Fuel Tax Agreement) reports a total distance of 10,000 km in all jurisdictions, of which 2,000 km represents the distance travelled in Ontario. While in Ontario, the carrier uses fuel to operate PTO equipment. The tax rate on the fuel used is 14.3 cents per litre. Based on the ministry approved allowance, it was determined that PTO activity accounts for 1,000 litres of fuel. 

The carrier calculates the Ontario PTO tax refund as follows:

  • Calculate the percentage of Ontario travel out of the total travelled distance

2,000 km ÷ 10,000km = 20%

  • Use the PTO litres to multiply the proportion of distance travelled in Ontario 

1,000 litres x 20% = 200 litres

  • Then, multiply the result above by the tax rate to arrive at the refund portion

200 litres x $0.143 = $28.60


Question: How and where can I apply for the refund?

Answer:

  1. You need to download and complete the application form online, which can be found on the Ontario Ministry of Finance website
  2. Read the accompanying guides, which help you navigate through the application
  3. Mail the completed application and all supporting documents to the Ministry. Make sure to keep one copy for your records. You can find the mailing address on the Ontario Ministry of Finance website


Question: What kinds of supporting documents do I need to provide?

Answer: 

For Refunds Under $500

You do not need to send in supporting documents with your application if the total of all refunds for a calendar year does not exceed $500. However, you will still need to keep your records for seven years in case the Ministry audits you.

For Refunds Over $500

You need to submit accurate and verifiable records of your fuel purchases along with your application to support a PTO refund claim. The invoice must show the following information:

  • The name and address of the seller
  • The selling price per litre
  • The amount of tax charged
  • The quantity of product purchased
  • The date of the sale

You also need to submit copies of proof of payment such as the account statement and cancelled cheque along with the receipted invoice. 


For PTO Claims on or After July 1, 2017

For PTO claims on or after July 1, 2017, additional documents are required:

  • A monthly summary of all fuel issues covering the entire claim period
  • Entries broken down by each licensed vehicle included in the claim
  • Based on verifiable information that may include inventory reconciliation reports from bulk storage facilities, daily disbursement logs, receipts from retail fuel outlets and issue tickets from card lock systems

Similarly, you are responsible for keeping all the records for seven years after you apply. If the Ministry selects you for an audit, you are required to present all the relevant records. 


Question: How to claim the refund?

Answer:

The fastest way for you to receive your tax refund is by signing up for direct deposit. It’s an easy and secure way to receive refunds or rebate. You can fill out the direct deposit authorization form on the Ontario Ministry of Finance website and include it in the submission package. 

All the information presented here is for informational purposes. At this moment, GoFleet cannot advise you on finance-related questions nor responsible for any issue related to the topic. We encourage your business to consult with a professional financial consultant to determine eligibility for the PTO tax refunds and discuss in detail how to apply. For more information, we recommend visiting the Ontario Ministry of Finance website to discover the more information on this topic. To learn more about the IOX-AUX harness and supporting accessories connecting to the PTO system, contact us today as our industry-specific experts at GoFleet will be happy to discuss with you in further detail. 

COVID-19 Recovery: Why Your Vehicle Data Is More Essential Now

The past few months have been an unsettling time for many workplaces as the COVID-19 pandemic has drastically affected businesses. Since this global pandemic started, Geotab recorded and reported on datasets to help fleets better understand the current landscape. As we are on the road to recovery, it is important for businesses to review how the commercial transportation sector is performing in relation to their own performance. Reviewing industry trends alongside personal vehicle data can allow fleets to make actionable decisions moving forward. 

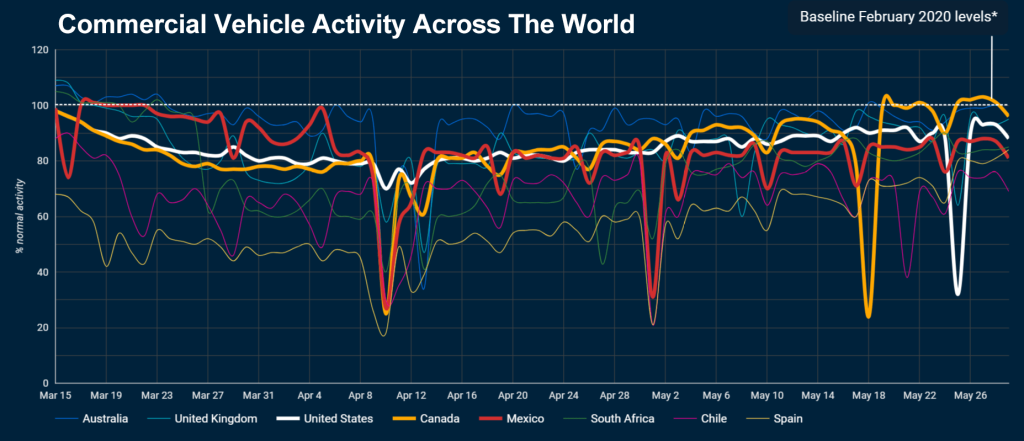
Below we use Geotab specific data that was updated on May 29, 2020, to help our readers better understand current commercial transportation activity, industry-specific activity, and fuel fill-up activity in relation to their operations. 


Commercial Transportation Activity: A Slow Increase 

With a baseline of February 2020 being used, it is clear to see in the image below that in comparison to the lowest dips in April 2020 (when many cities were in peak-response to COVID-19), there is a slow increase happening across the world. This is seen specifically in Canada, the United States, the United Kingdom and Australia. While there appears to be a rise and dip effect occurring, many view it to be a good sign that the dip does not last for long, as well that the rises are gradually increasing. 

Source: Geotab 

When speaking about the future, many believe that when businesses begin to reopen, their activity will drastically affect this graph. It is predicted that with more businesses reopening and requiring more inventory, stock or supplies, more vehicle use will occur. 


Industry Vehicle Activity: What Is Happening During The COVID-19 Recovery


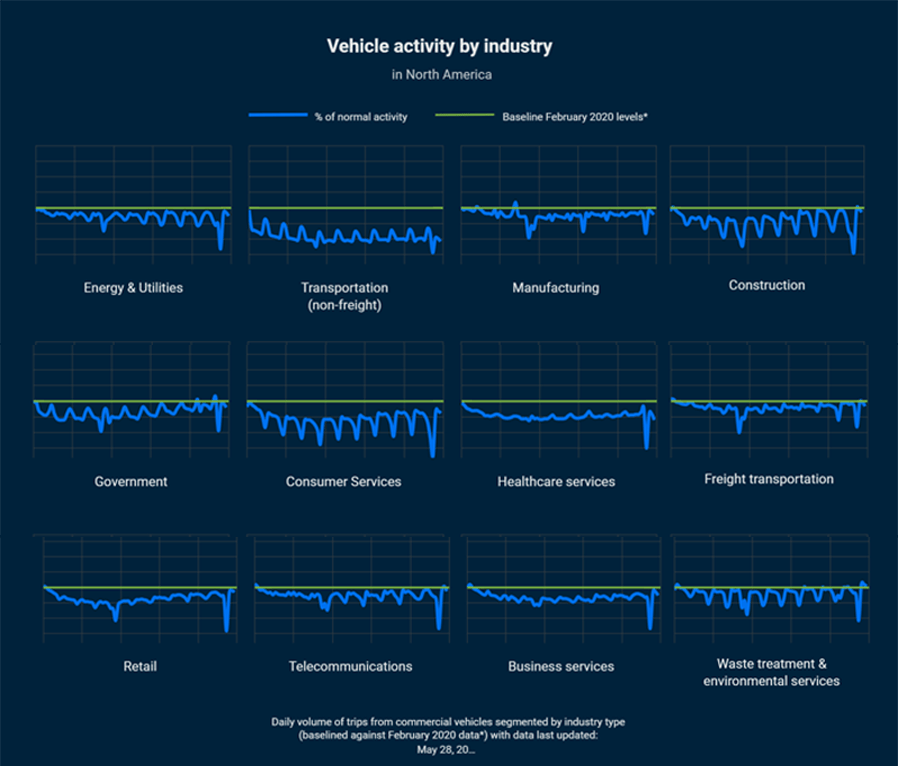
While the above graph may show positive signs that vehicle traffic is increasing, it’s important to note that it is not the case for all industries. Since February 2020, there are a number of industries where vehicle activity has not recovered as much as others in North America. These industries include non-freight transportation, healthcare services and business services. Many account this lack of recovery to be due to many unique businesses not reopening, or being unable to reopen to full-productivity. An example where this is visible is in the public transportation sector which has seen a continual decrease in activity as public transportation use is low (possibility as a result of the public not commuting to work as they are working from home). 

Source: Geotab 

Some industries to highlight that are steadily increasing are construction, government, freight transportation, retail and telecommunications. This slow increase is typically due to the reopening of many businesses that could no longer hold off operations and were approved by governments to slowly reopen. For example, within the construction industry, the longer work was paused, the longer the delays for construction to be completed. When speaking about condo developments or other development projects, many companies could not financially afford to hold off construction due to financial and contractual responsibilities to home buyers. 


Fuel Fill-Up Activity: What Increases Can Mean 

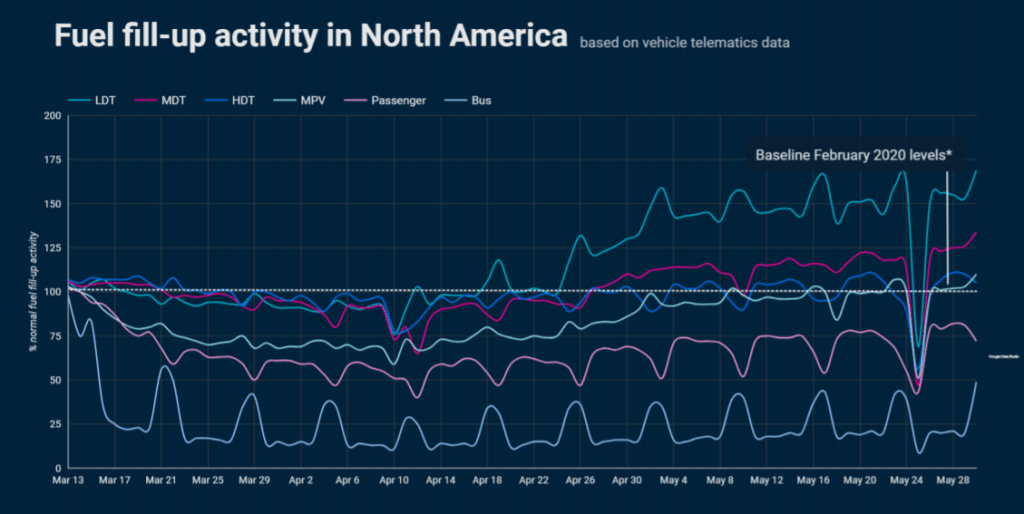
In North American the vehicle telematics data gathered by Geotab confirms that fuel fill-ups of varying larger-sized vehicles are increasing. The data shows that since the end of April, there has been a noticeable increase in the usage of LDT (light duty trucks) and MDT (medium duty trucks) vehicles. This is likely in accordance with traffic increases for industries who are looking to resume operations. It is important to note however, that there are some vehicles such as MPV (multi purpose vehicle), passenger and bus that may not see such increases in fuel fill-ups until there are less restrictions on public contact and public outings. The steady increase in varying industries is important to monitor because it allows for vehicle-based businesses to see how their specific industry is performing overall. 

Source: Geotab 


What Your Vehicle Data Means 

Properly Collecting Data 

With all of this information available, it’s important for businesses to use it to their advantage. Specifically, by reviewing the vehicle telematics data of their own business in accordance with industry competitors. By using telematics solutions businesses are able to review current operations and see whether their organization is on par with industry trends.


Collecting Your Own Data 

In order for businesses to truly see results from the data gathered by Geotab, there must be processes in place to collect information related to their fleet. If no solutions are currently in place, or businesses are unsure about what should be used, the first step is to use a GPS tracking device like the GO9. For the purpose of this discussion, the GO9 can be used to record the GPS location of vehicles and depict usage within detailed reports. As well, it allows for easy add-on hardware through an IOX expansion port to allow for future tracking of HOS ELD, auxiliary, temperature monitoring as well as other third party monitoring solutions.


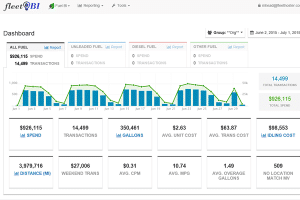
An additional tool to use to properly measure against the industry trends mentioned above, is to implement a fuel card integration. Using a tool like FuelBi allows fleets to better track the fuel fill-ups of company vehicles. While the device initially focuses on tracking and visualizing important fuel KPI’s and transactions, it is also used to monitor how frequently company vehicles are being filled. This directly shows the usage of company vehicles.


Comparing Company Data To Industry Data

When businesses reach the point that they have accumulated enough data to properly view how their fleet is performing, it can then be compared to the industry trends above. After reviewing the data in accordance to current industry trends, business owners and managers are encouraged to adjust their operations accordingly. What this means is that if businesses see that they are performing at a lower rate than their industry, they need to research why. Sometimes a lack of operational customers or possibly a decrease in availability of your team are the answers. As there are various reasons for why your business may not be recovering from the COVID-19 pandemic at the same rate as competitors, it’s important to work with professionals who can point out why this may be happening and offer solutions that drive results. 

Interested in working with a team who can help? Contact GoFleet today. Our team is experienced in data analyzation and consultation as our goal is to have every customer outperform their competitors. 

How Commercial Transportation Is Impacted By COVID-19

In recent news, not only has the medical community been affected by the outbreak of coronavirus, but the global supply chain as well. On March 11, the World Health Organization declared the recent outbreak of COVID-19 as a pandemic due to its sudden and concerning spread. In order to combat the spread of the virus, the public has been told to practice social distancing and many businesses have even been told to close their doors. However, it’s important to note that these are not the only changes that are happening as a result of the outbreak. In fact, the commercial transportation sector is finding that the public’s new way of living (as a result of being impacted by COVID-19) is also changing their operations. 


Below we discuss an overview of how the transportation industry is affected by leveraging fleet data provided by Geotab via intelligent solutions. Please note that the data was gathered on April 10, 2020, via their blog


How The World Is Impacted By COVID-19


With coronavirus infection numbers growing, there have been numerous efforts put into place to limit the spreading of the virus. One effort, the closing of numerous borders, may have affected travel, but not commercial transportation. Borders still remain open for those transporting goods because of the increased need of supplies and equipment in wake of the city lockdowns, community social distancing and more. 


Initial Changes In Commercial Transportation 


When discussing how essential the transportation sector is, as they are still able to travel across borders for deliveries, it’s important to highlight how there has even been movements towards making transporting essential cargo easier. Specifically the Emergency Declaration issued by the FMCSA and the Essential Freight Transport Exemption which was put into effect by Transport Canada. Both of which focus on adjusting the hours of service (HOS) regulation that drivers within the transportation sector must abide to. These changes allow drivers to drive over the maximum HOS in their country (meaning strict HOS regulations have been changed as a result of COVID-19). However, even though transportation seems more important than ever as they provide relief to communities needing essential supplies, it’s important to look at how the volume of commercial transportation vehicles may be changing. Specifically how the volume (which includes the number of trips and the amount of fuel used) has changed since the month of February.


Affected Volume In Activity 


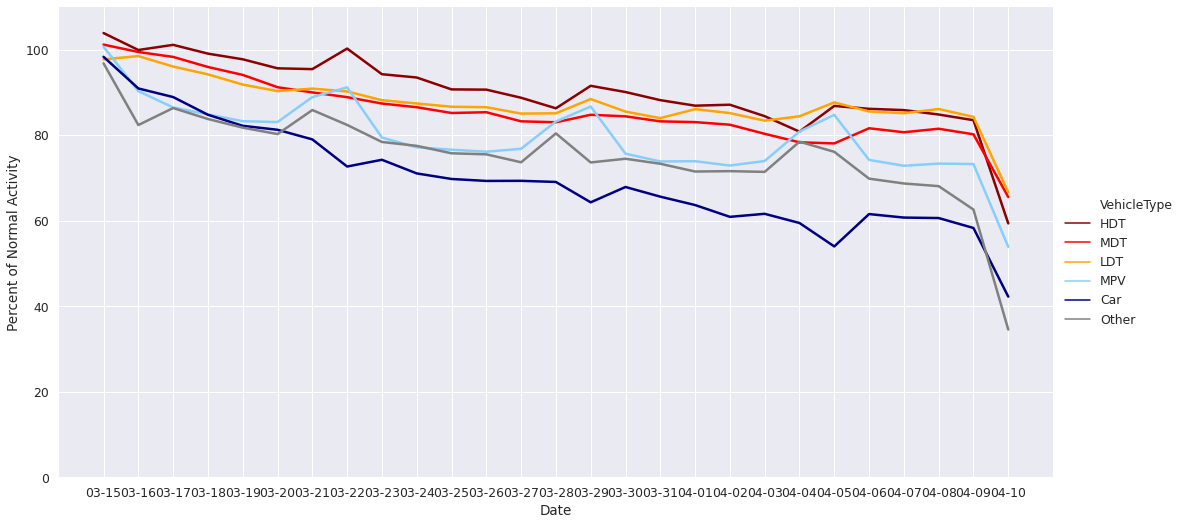
As one can imagine, there are countless changes happening to various industries. But when speaking to transportation, a decrease in commercial vehicle activity has been noted. Analyzing data that was collected from Geotab (from the dates March 15 to April 10), a noticeable decrease can be noticed in the percent of normal activity. With a baseline starting before March 15, continuing to April 10 – the time when many countries and industries started to be greatly impacted by COVID-19. Below is a graph which depicts the longitudinal view of commercial traffic volume that is being discussed. Specifically measuring the number of trips relative to normal activity, as well as the type of vehicle used. 

Source: Geotab; The impact of COVID-19 on commercial transportation and trade activit


As illustrated on the graph, various vehicles including heavy-duty trucks (HDT), medium-duty trucks (MDT), light-duty trucks (LDT), multi-purpose vehicles (MPV), as well as cars declined over time in regards to the amount of activity tracked. 


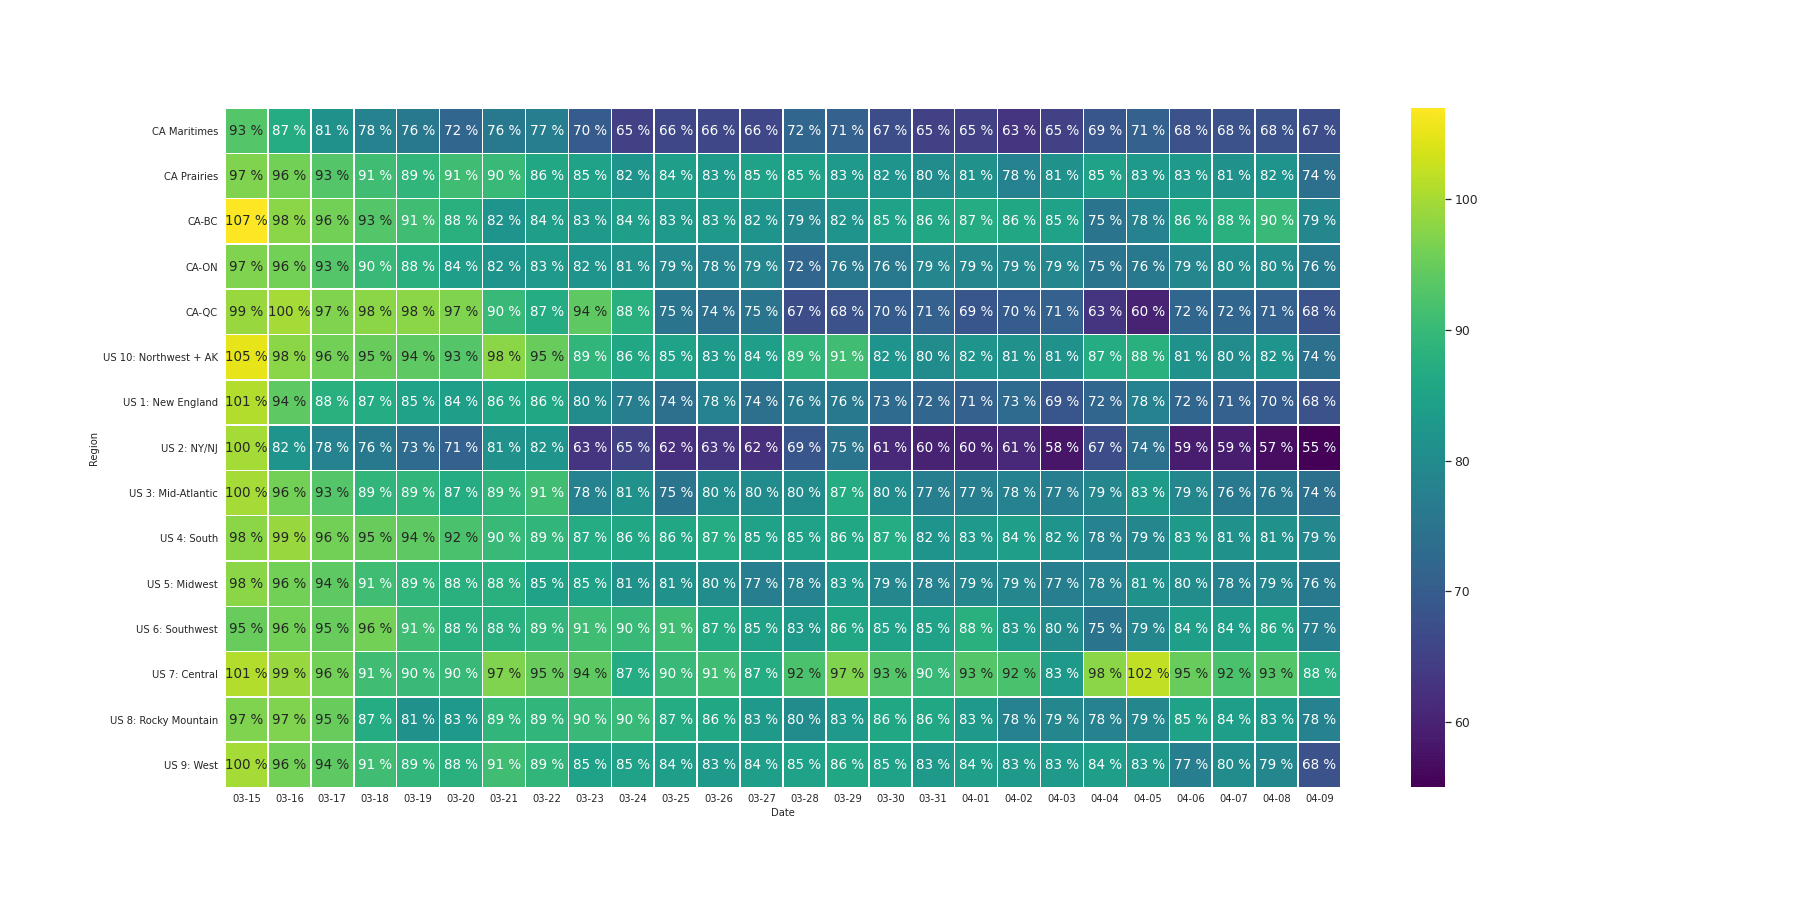
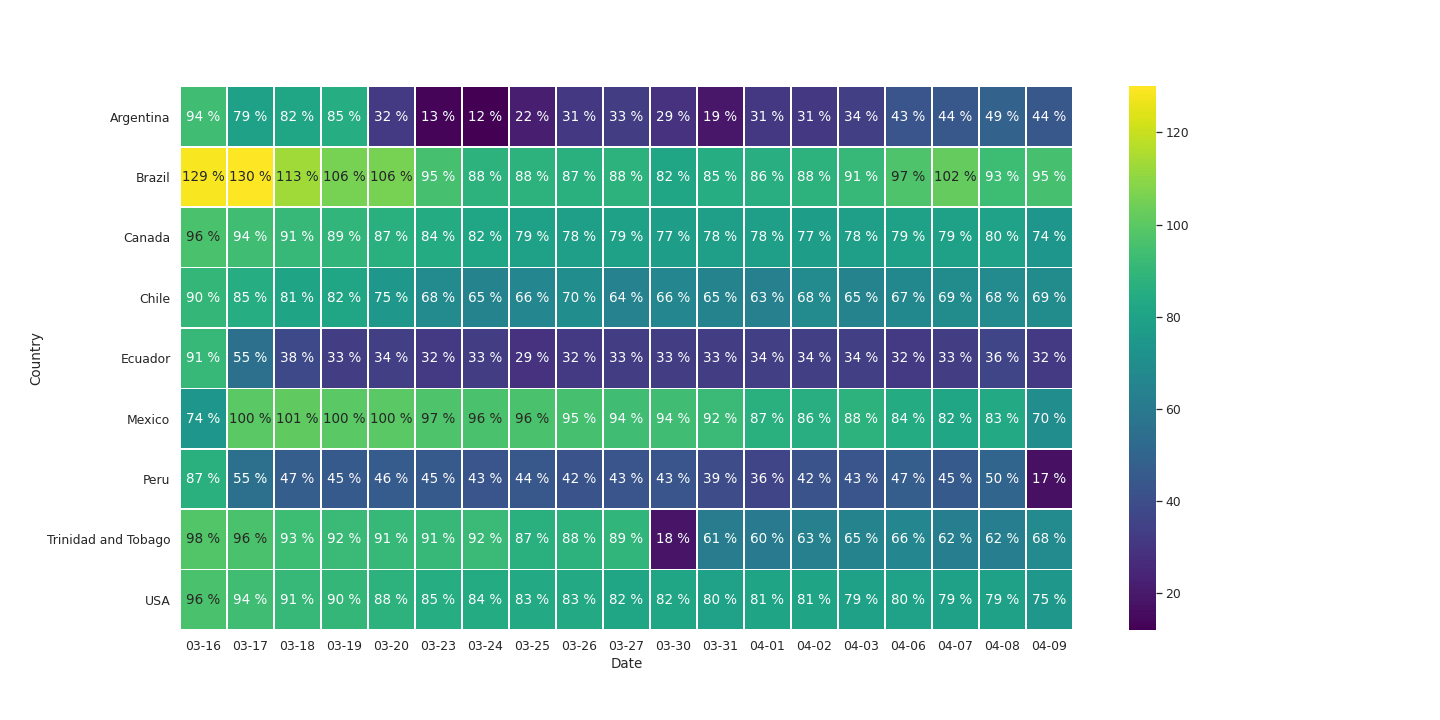
This decline is visible in a heatmap provided by Geotab when looking at data in regards to operating percentages and locations (micro regions in the U.S. and Canada). The chart compares what the normal operations percentage was in February 2020, to currently, in April 2020. 

Source: Geotab; The impact of COVID-19 on commercial transportation and trade activity

Source: Geotab; The impact of COVID-19 on commercial transportation and trade activit


In terms of Canadian changes, when looking at data from most recent weeks, compared to data from February 1 to March 15, Canada appears to be operating at 74% of normal commercial transportation activity. It’s important to note that the Maritimes is operating at the lowest when compared to normal – 67%. In comparison, the U.S. has also felt a large impact. The U.S. is operating at an average of 75% of normal commercial transportation activity. Reporting that the State of New York and New Jersey are the most impacted. They are only operating at 55% of normal activity. 


In brief, some other changes to highlight are; 

  • Ontario operating at 76% in comparison to 97%
  • Quebec operating at 68% in comparison to 99%
  • The West (US) operating at 68% in comparison to 100%
  • The Mid-Atlantic (US) operating at 74% in comparison to 100% 
  • The Midwest (US) operating at 76% in comparison to 98%  


Affected Fuel Usage 


With countless vehicles contributing to the commercial transportation sector, it’s also important to look at how these vehicles and usage are changing in terms of fuel during this time. Specifically looking at how fuel usage may be impacted by COVID-19 through decreasing commercial transport activity. 

Source: Geotab; The impact of COVID-19 on commercial transportation and trade activity 


The graph depicts that at the start of March 2020, there was a steady quantity of fuel being used among commercial vehicles. The data focused on vehicles that included buses, HDT, LDT, MDT, MPV, and passenger. A general decrease started on March 15, and continued until March 26. Since the end of March, the use of fuel in most cases did not recover to quantities previous to COVID-19, but is occasionally going through dips.


It is important to note that decrease was not as apparent within the trucking economy. Some may assume this is because while some operations may have changed, many commercial vehicles are still essential to transport supplies and equipment during this time. When reviewing the data of how the fuel usage of buses and passenger vehicles has dropped greatly, many assume it is because those vehicles are typically not operating at a high frequency due to health and safety recommendations. This includes how the public has been told to work from home (so there are less commuters) as well how the public is told to socially distance themselves from each other and stop public gatherings or events (so there is less travelling for leisure purposes).  


During This Change, Safety Is Critical 


With commercial transportation still remaining steady (with only minor dips) in terms of fuel use and volume, it’s safe to say that the industry is still steady. What this means is that even at a time where so much is in flux, the transportation sector is critical for many communities as they can provide essential supplies among other necessities.  


However, with so much uncertainty surrounding coronavirus and how businesses are impacted by COVID-19 in terms of safety and the length of the pandemic, it’s important for those who are on the frontlines to do what they can to stay safe. One way when speaking to the transportation sector, is for drivers and other delivery personnel to monitor for potential symptoms. Proactively monitoring for coughs, fevers and other signs of viruses can help reduce the possible and unknowing spread of the virus. Especially when speaking about individuals who are travelling constantly and moving cargo. Tools like ZenduCheck, a digital symptom monitoring app, allows drivers and other essential personnel to monitor their health. To learn more about how symptom monitoring can be useful in promoting safety in fleets, click on the button below. 

Electric Vehicles In Fleets: Research Before You Implement

Electric vehicles are the future and many are anticipating that in the upcoming years, they will be increasingly popular in fleets. While there can be numerous benefits that arise from using these innovative modes of transportation, fleet managers must keep in mind three key factors prior to implementation. Specifically, how telematics solutions, real-world driving conditions and incentives should be reviewed. 


What Benefits Are Enticing Businesses? 


As technology evolves, companies continue to see new ways that they can utilize innovation to their advantage. When discussing EVs, many fleet managers are intrigued to adopt them because of varying benefits;


  • Lowering spending on fuel as many find that the cost to ‘plug-in’ their vehicle in comparison to purchasing gasoline or diesel can be lower
  • Reducing the cost of maintenance on vehicles as electric drivetrains can in some cases be lower to maintain as it’s functionally simpler 
  • Employee experience can improve as employee satisfaction, performance and retention reportedly increase as team members can feel more aligned with company goals and initiatives 
  • Better corporate sustainability as the company is proactively adjusting their actions to lower their environmental footprint


What Fleet Managers Should Keep In Mind Prior To Implementing Electric Vehicles


Monitoring Vehicle And Fleet Performance 


Similar to a traditional fleet, EV fleets must also have the right resources available to monitor their vehicle and fleet performance. Overlooking this key detail could leave fleets at risk for being inefficient or unproductive without even knowing it! Just like a traditional fleet, electric vehicles must be kept in peak working condition and routes need to be well organized to make sure the investment is worth it. 


Real-World Driving Conditions And Batteries 


Depending on the size and purpose of your fleet, you may find that certain electric vehicles will function better for your business. This stems upon the fact that your needs and the available technology will vary since the electric vehicle industry is still growing. Some key factors to keep in mind are; average daily use, accessibility to charging stations during transportation, the logistics of charging time, the costs and frequency of charging, as well as environmental (roadway) conditions. These all play a factor in what vehicle you should use as the lack of charging stations, the weight of cargo being carried or even rough road terrain could make using an electric fleet more expensive or unrealistic.  


For example, if your team frequents a route with limited access to charging stations, you may find that you will need to wait until electric battery charges improve or charging station access increases. It’s also worth highlighting how hybrid electric vehicles could be the better choice right now as they are not so limiting in terms of battery and charging options. Plug-in hybrid electric vehicles (PHEV) and conventional hybrid electric vehicles (HEV) use electric motors in addition to gas engines which limits the stress of finding a charging station to ensure a timely delivery. 


EV Incentives 


It’s no surprise to hear that transitioning a fleet from gas to electric-powered vehicles can be costly, so do your research about incentives available to you. As there is a large focus on the environment, governments are creating numerous incentives with varying electric vehicle tax credits to encourage the popularity of EVs. With the opportunity to receive thousands of dollars back in tax credits, it’s something businesses must take advantage of if they are investing in an electric fleet. 

Regardless of if you’re thinking of deploying electric vehicles into your fleet, it’s critical to stay updated on current industry trends. As technology is always advancing and businesses are continuing to find innovative ways to grow, you must stay informed. One way to do this is to sign up for our newsletter as we send out monthly updates about trends and telematics technology. Make sure you scroll down and fill out the form to stay updated!